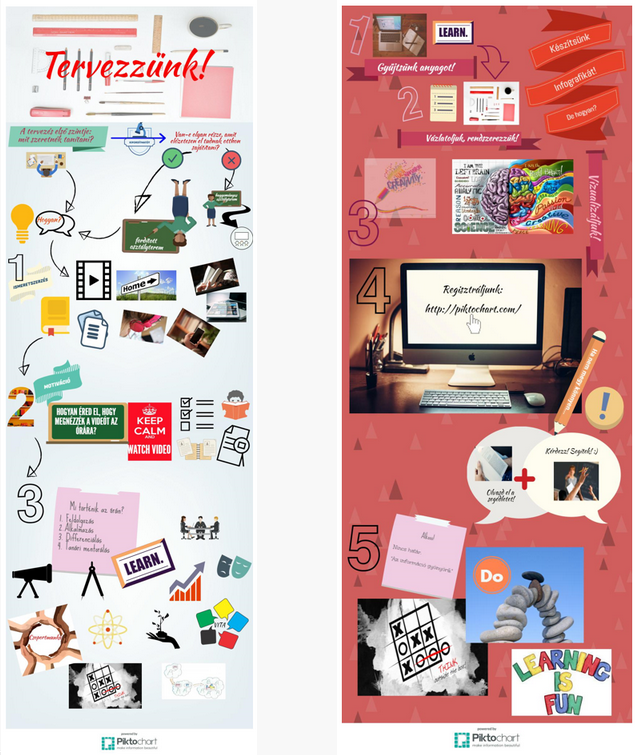
An infographics application with which we can present the information to our students by organizing it into an image. The program is easy to use, its possibilities are endless, as our language has long been familiar with the law: a picture says more than a thousand words.
Following registration, you can choose from existing templates, but you can even start working on a completely blank “canvas”. From the control panel on the left, you can drag or click to select the desired background, font, color effect, and add an image, text, link, icon to your work. The site works with a huge pre-loaded image and icon database, so we can create our own infographics in a matter of seconds, but if we can't find one among the visual elements that would express our thoughts, we have quite a lot of storage space where we can upload our own images. Finally, we can download the work completed.
Infographics can be used to check understanding of the topic (e.g. students can summarize what they've learned in an infographics), but it can also be systematised: it can be used to visually display any part of our curriculum, from word types to historical events.